
Often we need to visualize complex data in a fancy way. The core JavaFX controls are sometimes capable to do it, but most of the time they are not. So the question is: do we need to write a custom control?
The answer is: depends! Since JavaFX supports the famous WebView, we can also use some embedded HTML5 with JavaScript libraries like D3.js to visualize data driven documents.
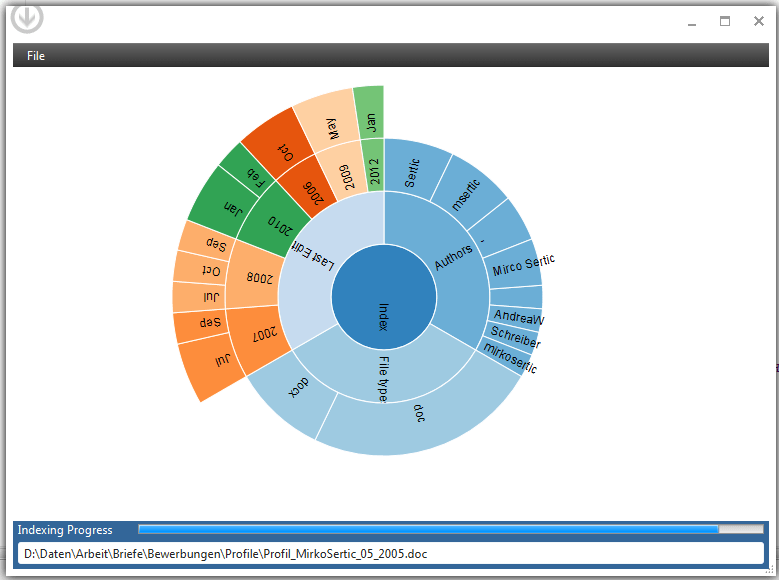
To show how this works i used the JavaFX Desktop Search example and added an animated sunburst chart with D3.js support to show the document distribution by author, last modification time stamp and document type. This is how it looks:
The zoom-able sunburst code was taken from this blog: http://bl.ocks.org/metmajer/5480307. Thanks a lot for this great work!
D3.js is a very powerful JavaScript library supporting a lot of display formats. The sources of JavaFX Desktop Search are available at Google Code here.
So often we can use existing JavaScript libraries to visualize complex data, no more need to write a custom control. Cool!