
JavaFX is quite cool. The scene graph concept is quite powerful, combined with visual effects like animation, shadows or motion blurring can create very nice looking user interfaces.
At the moment, JavaFX comes with a set of predefined Form elements(called Controls), and other primitive objects(called Shapes). This is enough to create most of user interface currently needed for business purposes.
But there are also some Controls missing, like a TreeTable and other stuff. I hope this will be added in the near future.
I wanted to create a custom JavaFX control for displaying simple, generic, interactive graphs. I want to do graph node selection using the mouse, have support for multiple selection, drag & drop and also edges for node connectivity, so project MogwaiFXGraph was born!.
Here is a screenshot how it is looking:
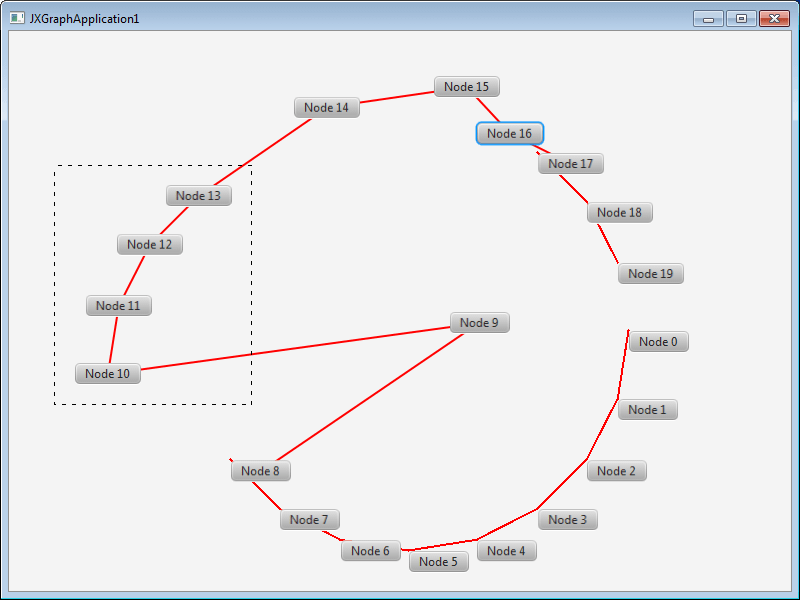
The graph is created using the following example JavaFX application:
import javafx.application.Application;
import javafx.scene.Scene;
import javafx.scene.control.Button;
import javafx.stage.Stage;

import java.util.ArrayList;
import java.util.List;

public class JXGraphApplication1 extends Application {

    @Override
    public void start(Stage aStage) throws Exception {
        aStage.setMinWidth(800);
        aStage.setMinHeight(600);
        aStage.setTitle(getClass().getSimpleName());

        FXGraphBuilder theBuilder = FXGraphBuilder.create();
        FXGraph theGraph = theBuilder.build();

        List<FXNode> theNodes = new ArrayList<FXNode>();
        int centerX = 400;
        int centerY = 300;
        int numNodes = 20;
        int radius = 220;
        for (int i = 0; i <numNodes; i++) {
            Button button1 = new Button();
            button1.setText("Node " + i);

            double positionX = centerX + Math.cos(Math.toRadians(360 / numNodes * i)) * radius;
            double positionY = centerY + Math.sin(Math.toRadians(360 / numNodes * i)) * radius;

            FXNode theButtonNode = theGraph.createNodeFor(button1, positionX, positionY);
            theNodes.add(theButtonNode);
        }

        for (int i = 0; i <theNodes.size() - 1; i++) {
            theGraph.createEdgeFor(theNodes.get(i), theNodes.get(i + 1));
        }

        aStage.setScene(new Scene(theGraph));

        aStage.show();
    }

    public static void main(String[] args) {
        Application.launch(JXGraphApplication1.class, args);
    }
}
We can select nodes, aka. cells, by using the mouse, dragging them around and change the selection in an interactive way. The first prototype was written within two days, so you see how simple it can be to create custom Controls and nice looking UIs with JavaFX.
The project is hosted on GitHub, so please visit JavaFX Graph for more information.